Azure Site Recovery is a Microsoft product that is increasing in popularity for use in Disaster Recovery plans. One gripe I have had with it, is the lack of RPO history of a replicated VM. You can define a RPO of 1 hour but you have no way in the GUI or via PowerShell to see the historical RPO. When a VM creates a lot of churn at the weekend and triggers your defined RPO alarm, how far out has it gone?
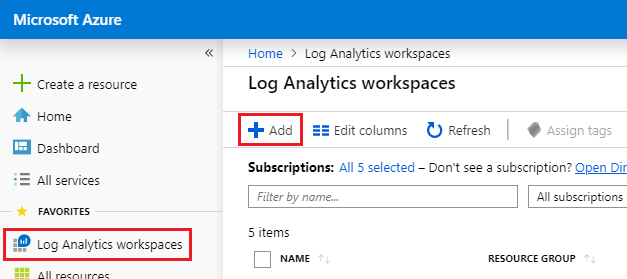
There is now a workaround which we can use until Microsoft make the reporting more mature. You can now send the Azure Site Recovery stats and diagnostic information to an Azure Log Analytic workspace and report on it. To set this up, first of all, create a Log Analytic workspace. Click Log Analytics workspaces and click add.
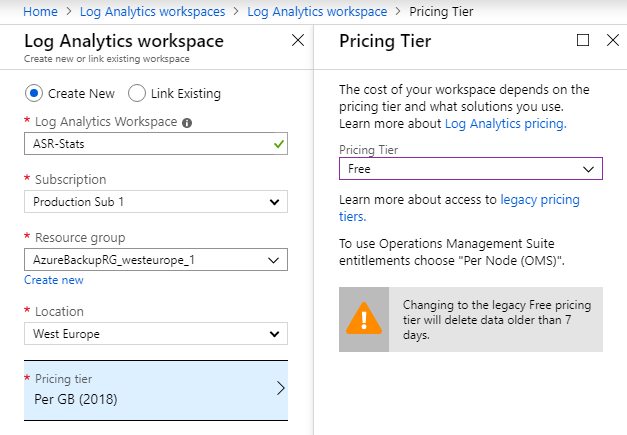
Choose whatever details you want to use. I created one here in the free tier.
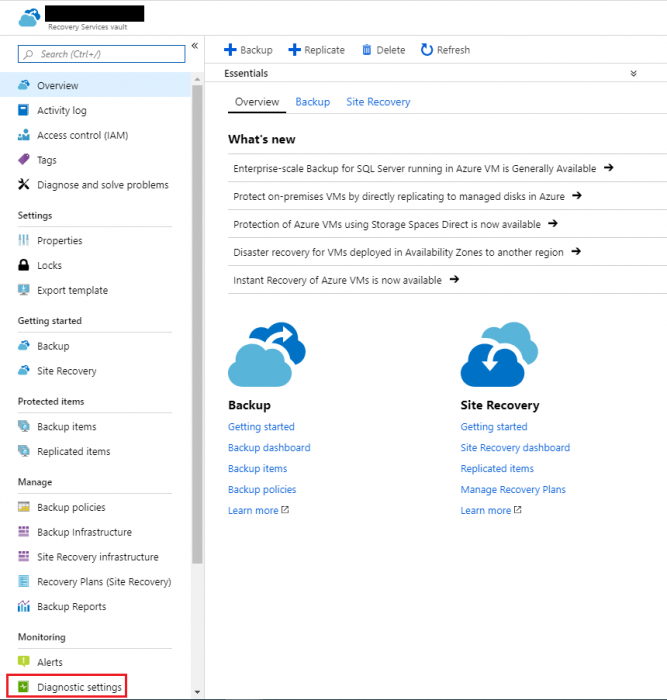
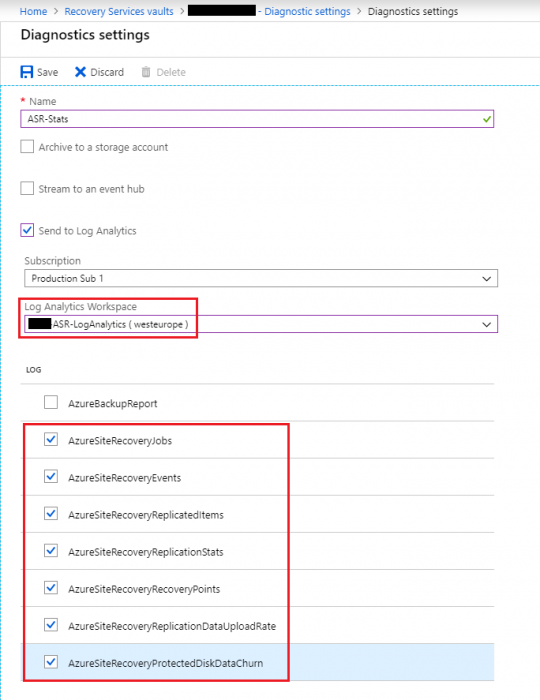
Once created, navigate to your Recovery Services vault and click Diagnostic settings down the bottom left.
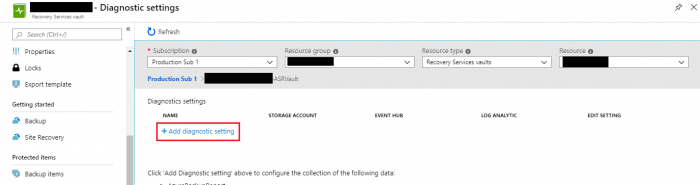
Click add diagnostic setting
Now select the Log Analytics workspace you created earlier. Be sure to tick all the boxes down the bottom except Backup Report.
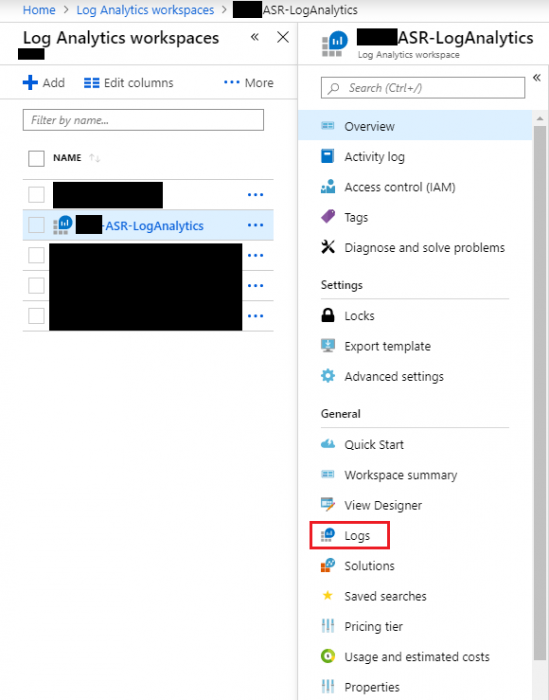
The diagnostic information will now feed into the Log Analytics workspace you created earlier. It can take a while for data to start to feeding into it. I normally leave it a day or 2 to collect some useful info. To report on the data collected, go into the workspace you created and click Logs.
I have added some sample queries you can run below.
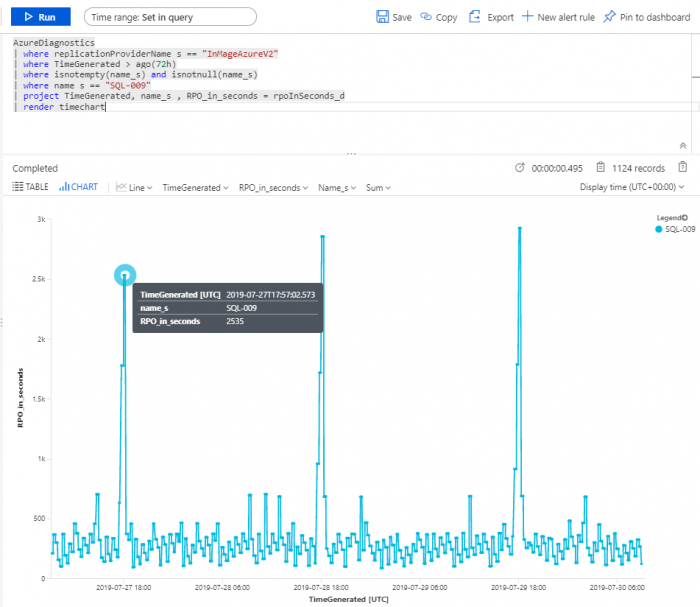
In the example below I have run a query for the VMware to Azure job for the VM SQL-009 for the last 72 hours. We can see the spikes in RPO. This is useful for trying to work out when the RPO drifts, you can then investigate if needed.
AzureDiagnostics
| where replicationProviderName_s == “InMageAzureV2”
| where TimeGenerated > ago(72h)
| where isnotempty(name_s) and isnotnull(name_s)
| where name_s == “SQL-009”
| project TimeGenerated, name_s , RPO_in_seconds = rpoInSeconds_d
| render timechart
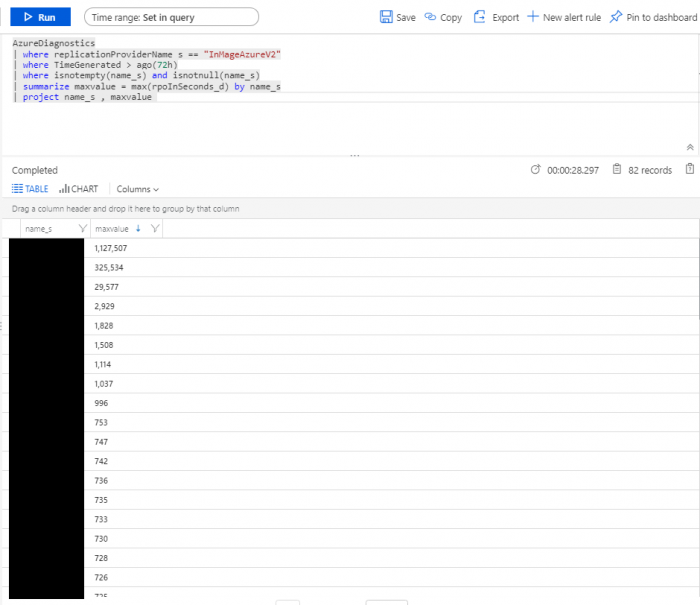
The query below outputs a table which details the max RPO for each VM over the last 72 hours. The VM with over 1 million RPO is due to the source VM being turned off…..
AzureDiagnostics
| where replicationProviderName_s == “InMageAzureV2”
| where TimeGenerated > ago(72h)
| where isnotempty(name_s) and isnotnull(name_s)
| summarize maxvalue = max(rpoInSeconds_d) by name_s
| project name_s , maxvalue
At what frequency are the diagnostic logs sent to Log Analytics by Azure Site Recovery?
- AzureSiteRecoveryReplicationStats and AzureSiteRecoveryRecoveryPoints are sent every 15 minutes.
- AzureSiteRecoveryReplicationDataUploadRate and AzureSiteRecoveryProtectedDiskDataChurn are sent every 5 minutes.
- AzureSiteRecoveryJobs is sent at the trigger and completion of a job
- AzureSiteRecoveryEvents is sent whenever an event is generated
- AzureSiteRecoveryReplicatedItems is sent whenever there is any environment change. Typically the data refresh time is 15 minutes post a change.
How much data can be retained in Log Analytics?
- By default, the retention is for 31 days. You can increase it by going to Usage and Estimated Cost section within your workspace. Click on Data Retention and choose the range suited to your needs.
What is the size of diagnostic logs?
- Typically the size of a log is 15-20 KB.
Thanks to the ASR team @ Microsoft for their assistance with getting this setup. They are due to update their documentation shortly with information on this. I will be sure to add this link once up and running.